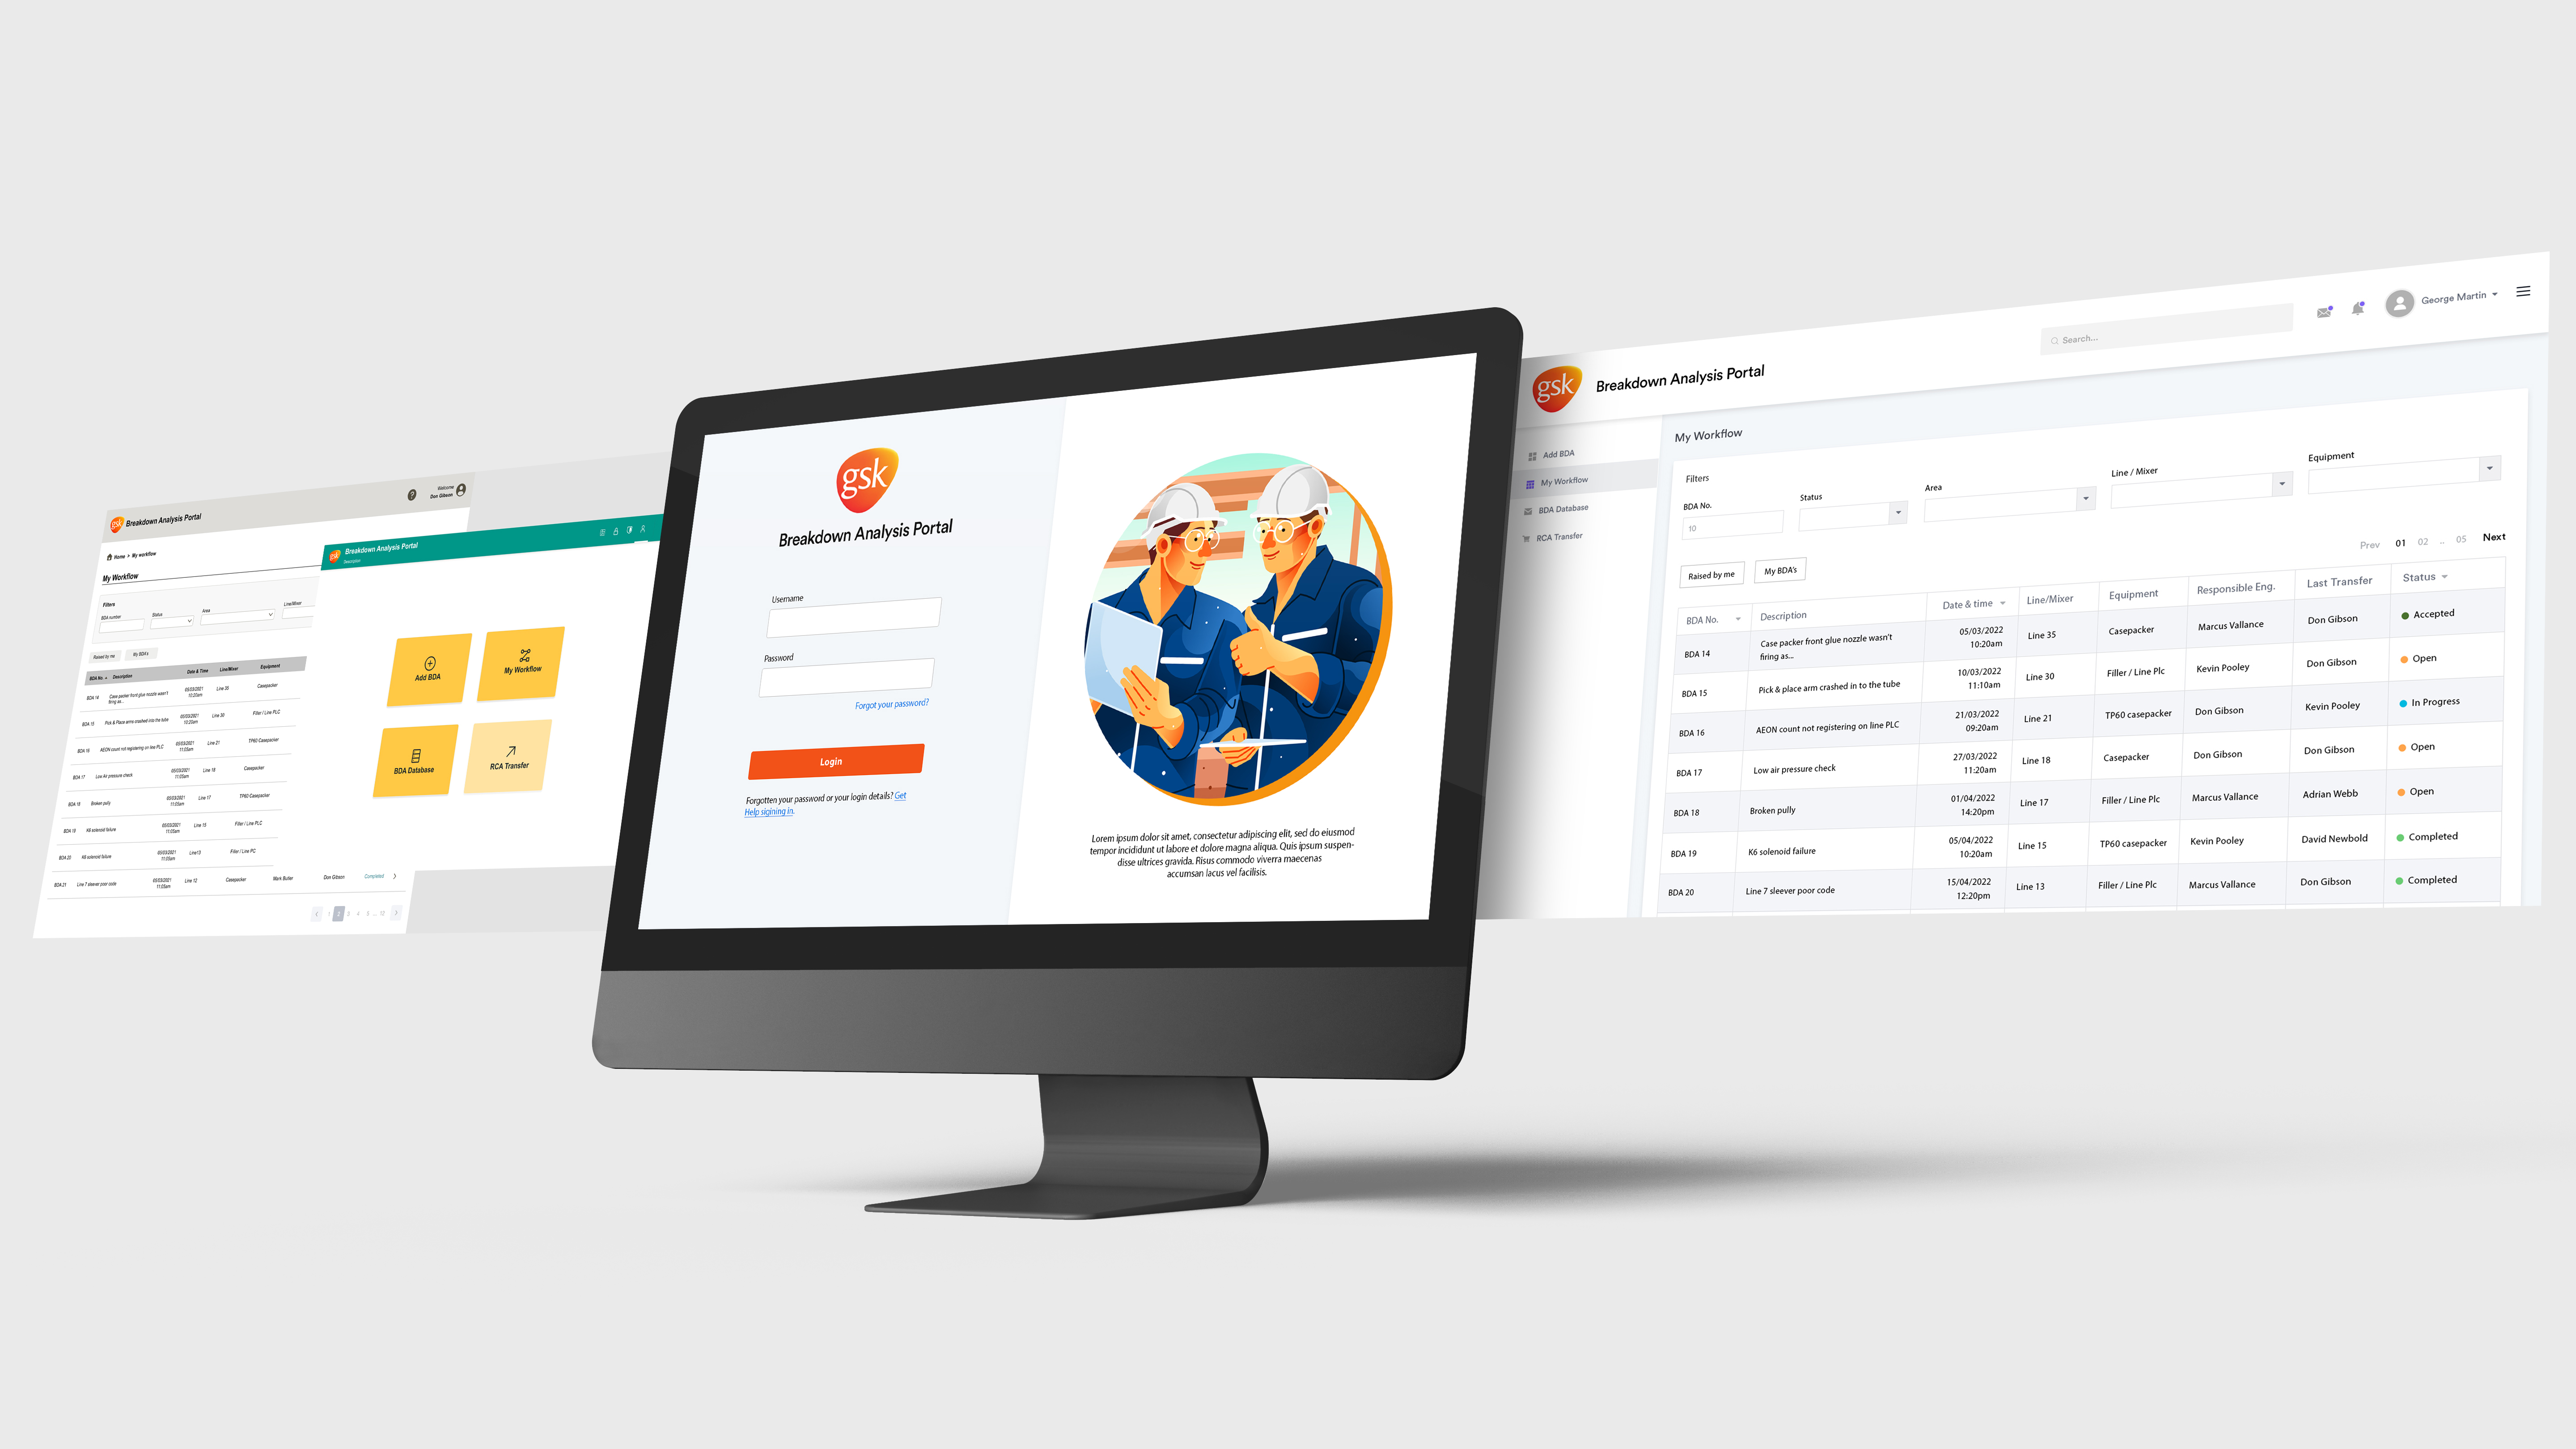
Breakdown Analysis Portal is a project that involves creating a digital platform for Engineers & Technicians to carry out planned preventative maintenance, deal with breakdowns and provide support to investigations and continuous improvement initiatives. The primary goal of the BDA portal is to provide a centralized and efficient means of tracking, analyzing, and resolving breakdowns or problems.
Users are experiencing challenges in navigating our platform due to a complex information architecture, resulting in frustration, and a decline in user satisfaction. The current system fails to provide intuitive pathways for users to access information efficiently, hindering the overall user experience. Addressing these issues is crucial to improve user engagement, retention, and the overall success of our platform.
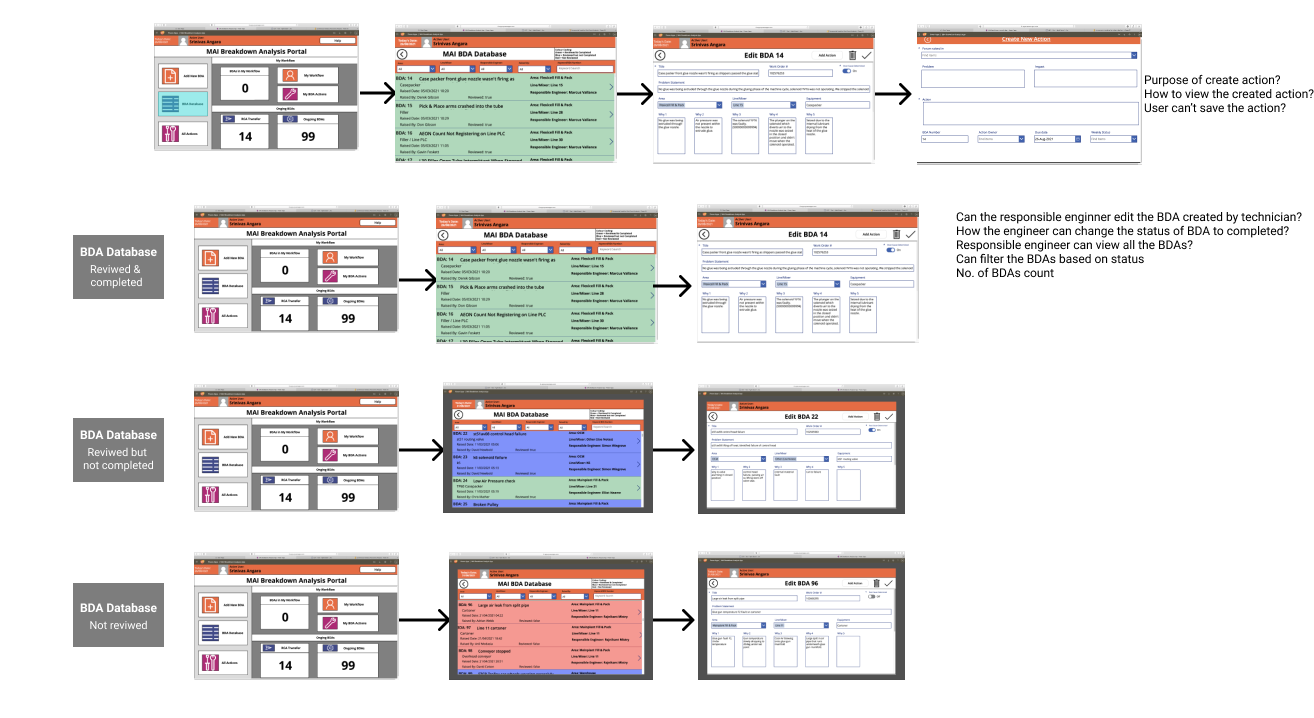
As a first step, I will aim to gain a clear understanding of the business and user goals. What does the client or stakeholder hope to achieve with this product? I will identify the target users and understand their goals, pain points, and preferences through user research methods. This involves mapping out the various tasks users will perform within the system and understanding the user journey and the steps involved in completing specific actions. Additionally, I will develop an initial information architecture, organizing the content and features in a way that makes sense for users.
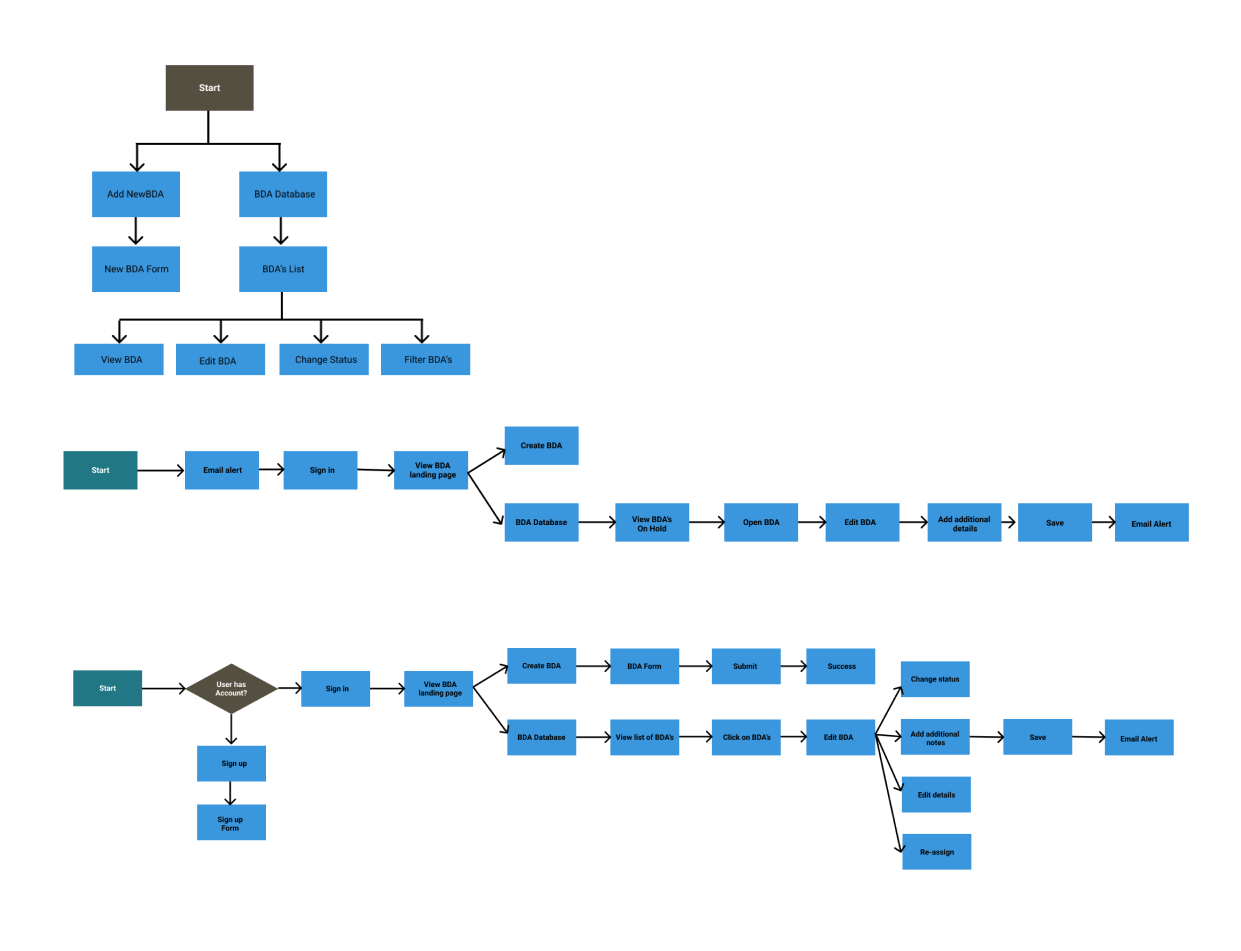
After conducting user research and analyzing interview findings, I created a user task flow diagram that outlines the key steps and processes for engineers and technicians take to perform planned preventative maintenance, address breakdowns, and support investigations. It helped us to identify potential bottlenecks and ensures a seamless and efficient workflow within the digital platform.
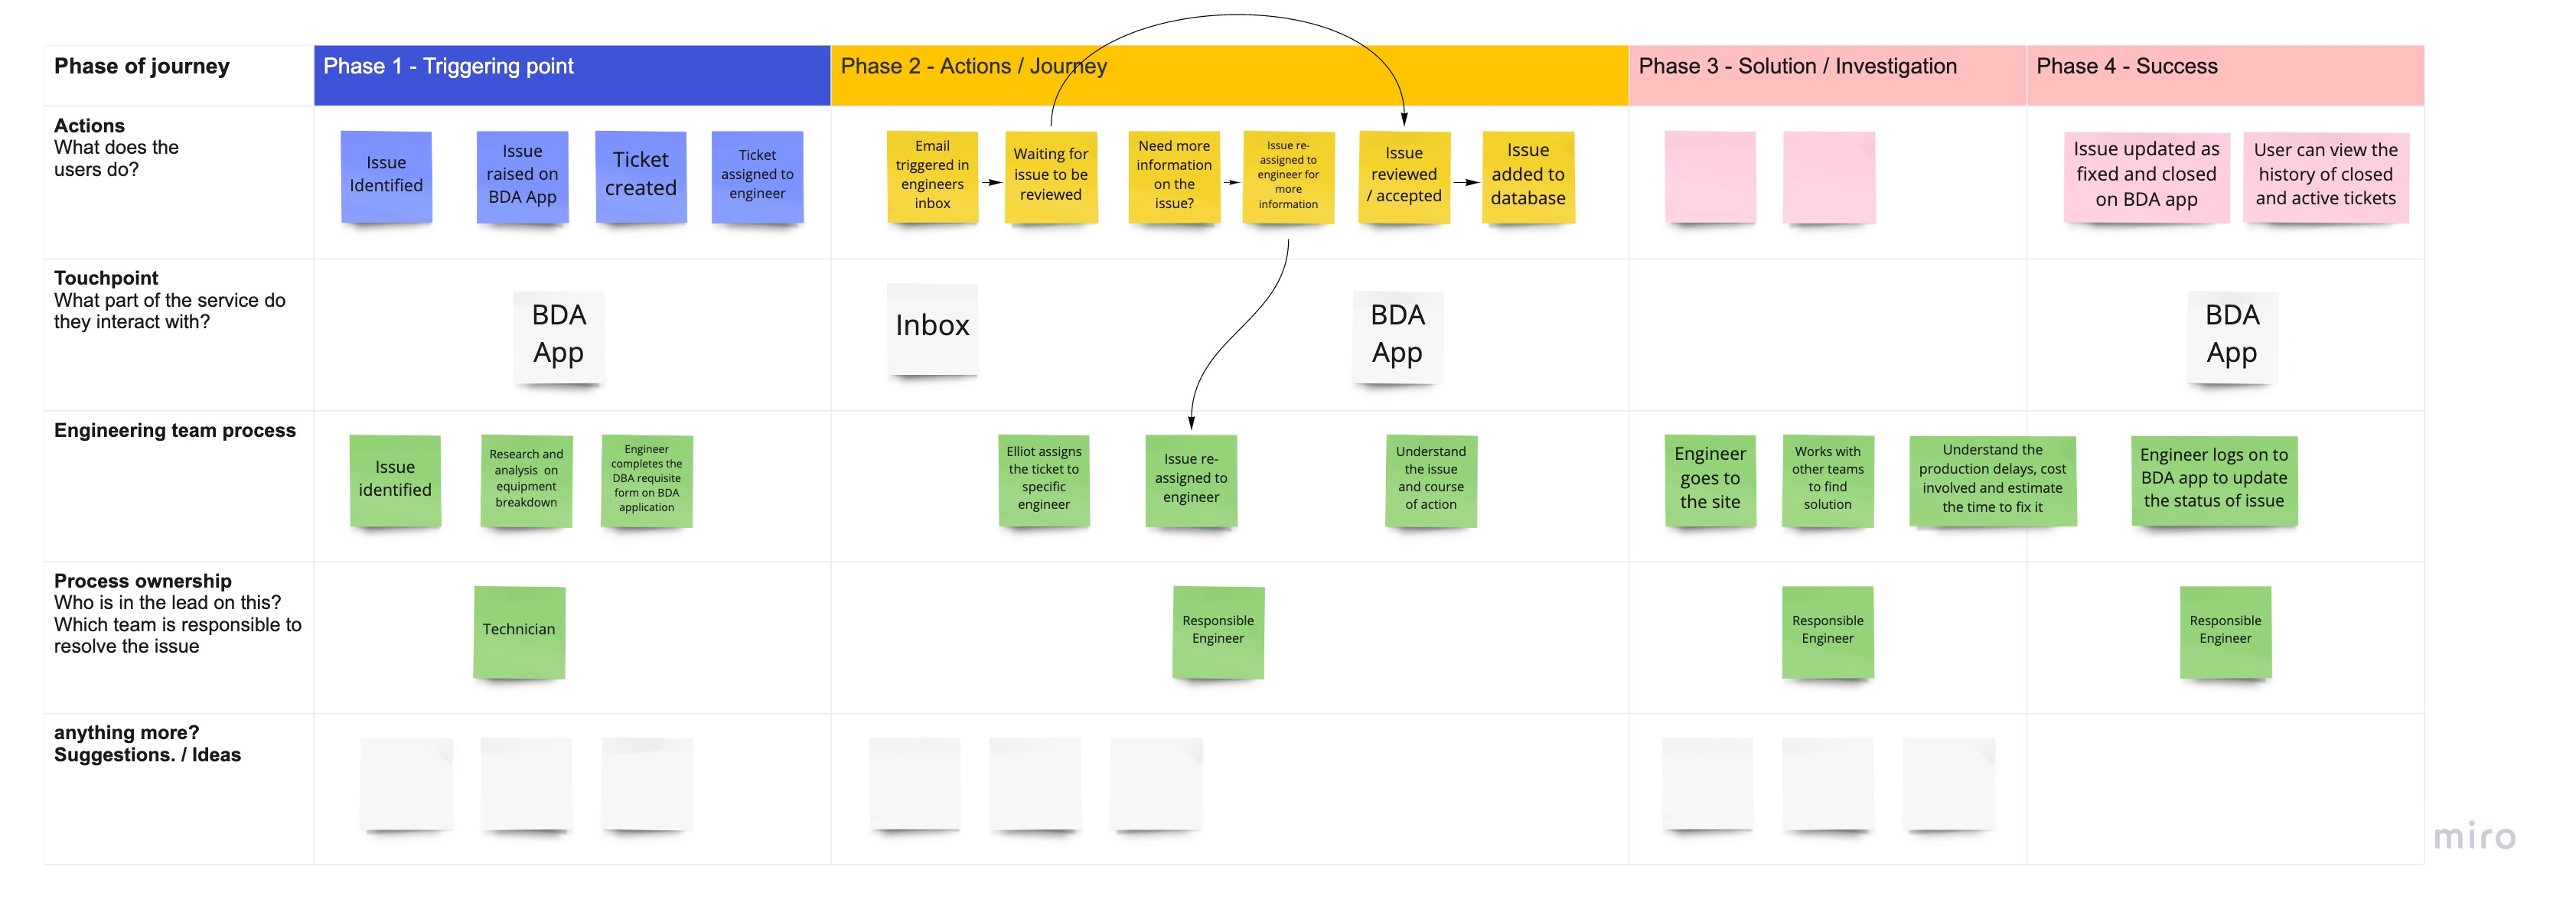
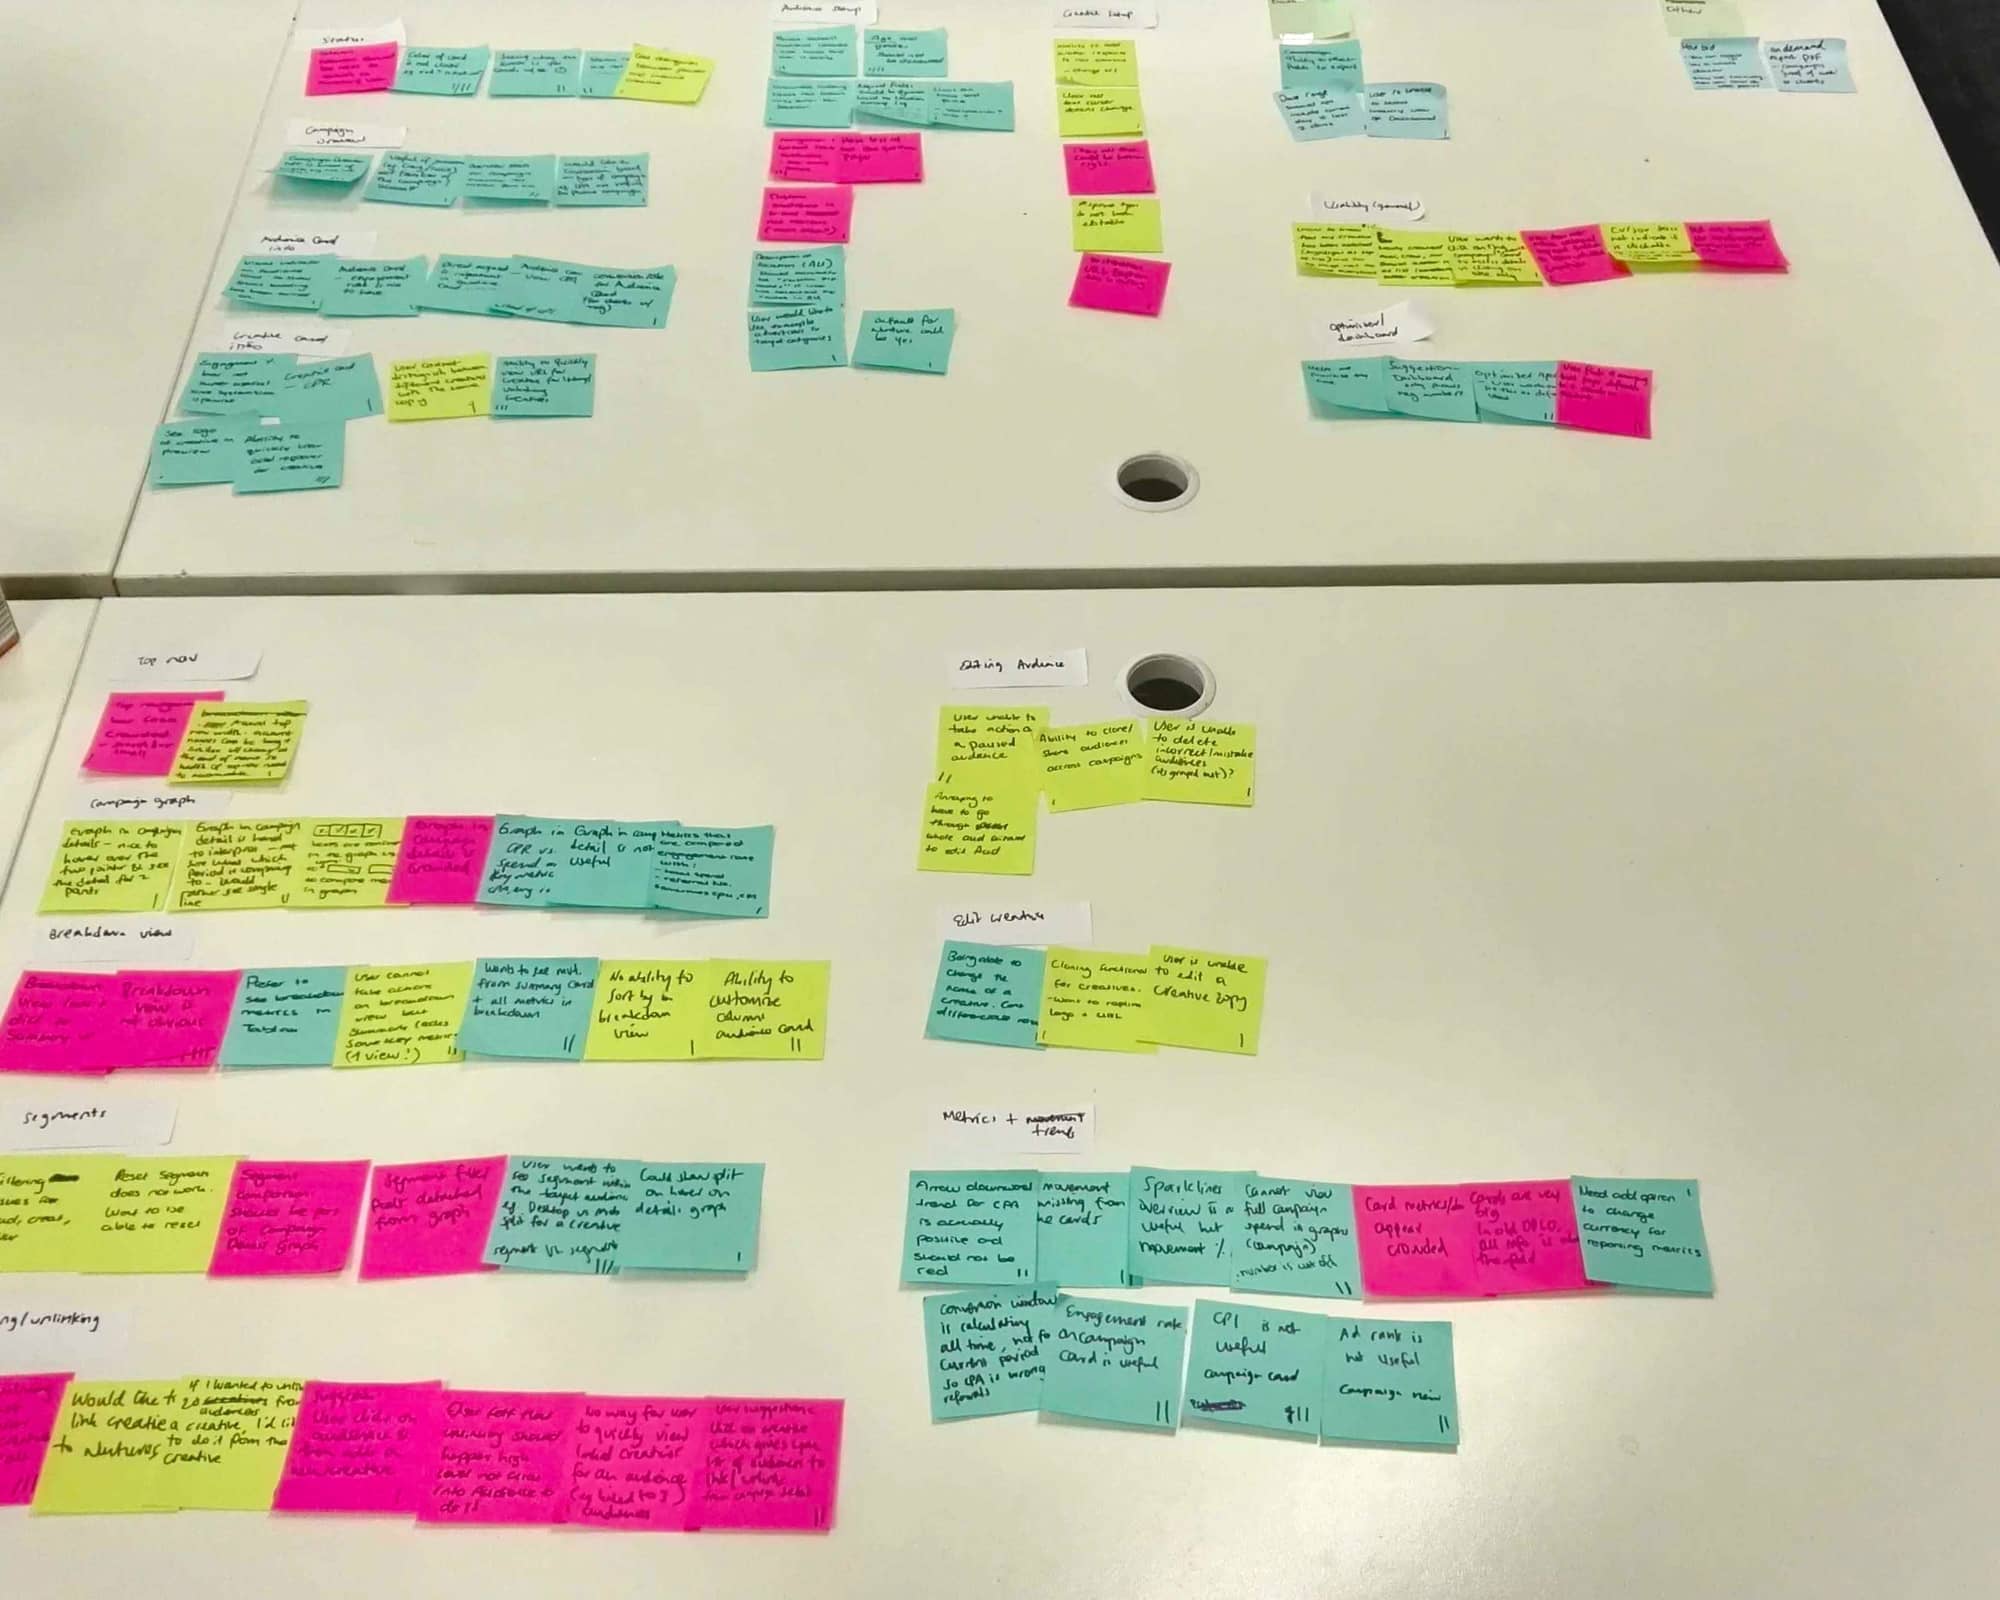
All of the above process has helped me in Identifying the users primary goals, pain points aim to achieve when interacting with the application.
After establishing my task flow, I started sketching some ideation sketches of what the application could look like when translated digitally. I made multiple versions, shown below is the chosen sketch that I based my wireframes on.
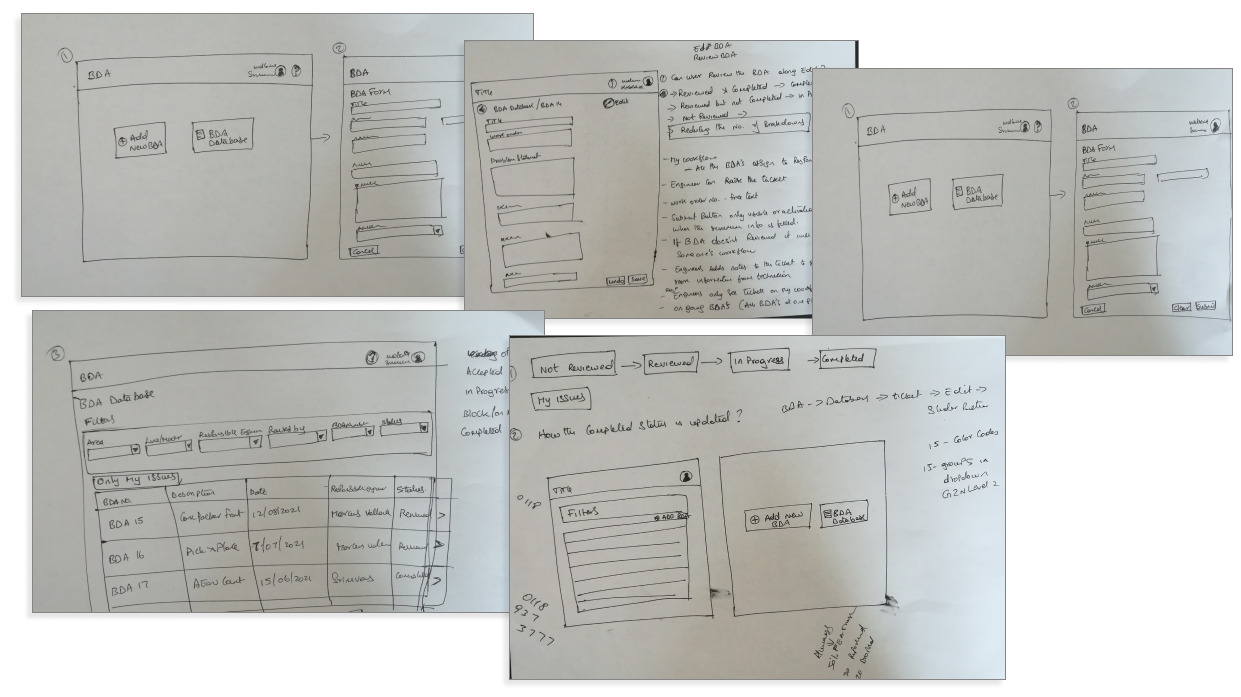
Creating the user interface involved multiple iterations and concept explorations