Haleon - Carbon Emission Dashboard

greensill.com
Project Description

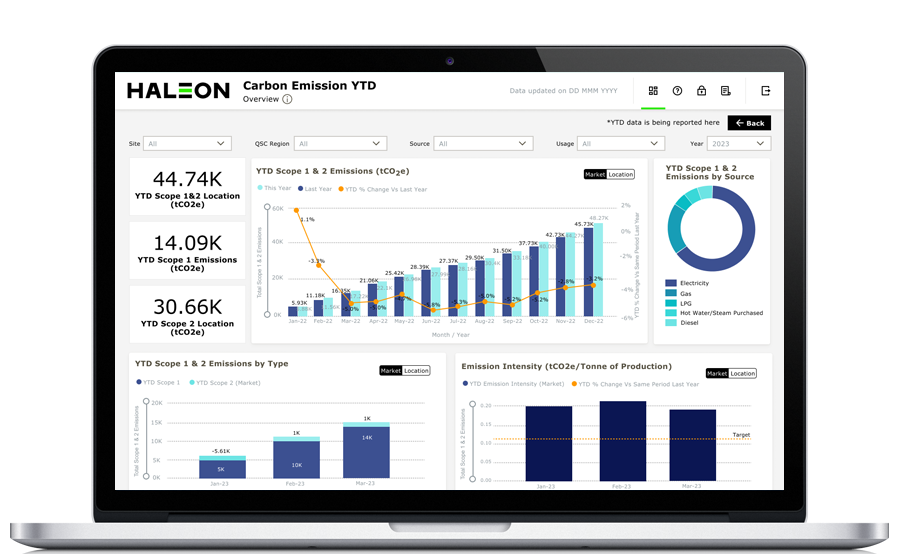
Carbon Emissions Dashboard goal is to empower stakeholders with the tools and insights needed to actively manage and reduce their carbon footprint, contributing to environmental sustainability and responsible business practices. The primary objective is to promote sustainability and environmental responsibility by providing real-time and historical data of the Haleon's carbon footprint, helping the stakeholders to make informed decisions to reduce environmental impact.

Problem Statement

To address, analyze large volumes of data related to carbon emissions from various sources and Haleon sites and present it in visually engaging charts. The challenge is to design an intuitive user interface that should provide real-time or near-real-time updates on carbon emissions to enable timely interventions and adjustments according to Haleon's sustainability goals.

Role & Responsibilities

As the UX and UI Designer for this project, my role is pivotal in addressing the challenges mentioned above and Create visually compelling and informative data visualizations that effectively communicate complex carbon emissions data, trends, and key performance indicators.

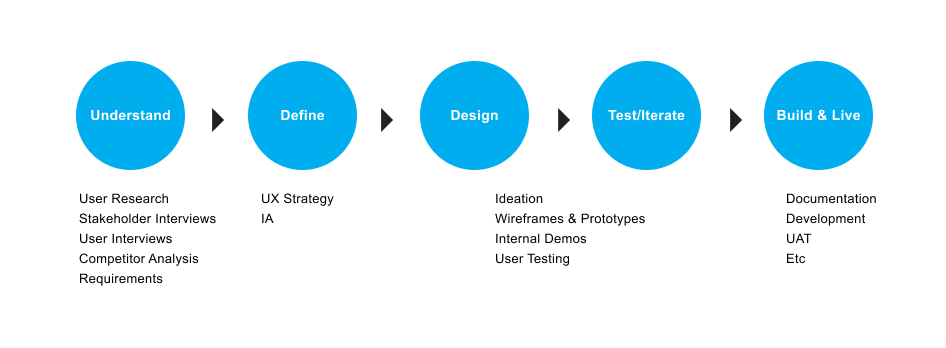
  • Conducting user interviews and understanding the needs and preferences of different stakeholders.
  • Designing a logical and intuitive information structure that organizes the data in a meaningful way.
  • Creating wireframes and interactive prototypes to visualize the layout and functionality of the dashboard.
  • Designing a visually appealing interface that aligns with the Haelon Company's brand and effectively communicates data through charts and graphs.
  • Conducting UI testing / Interviews to gather feedback and iteratively improve the design for enhanced user satisfaction.
  • Collaborating closely with Power BI developers to ensure the seamless integration of design elements into the dashboard.
Design Process
Design Process

As a frist step I will try to get a clear understanding of the business & user goals. What does the client or stakeholder hope to achieve with this product. Determine who are the users will be using the product and understand their goals, pain points, and preferences by user research methods. Mapping out the different tasks users will perform within the system. Understand the user journey and the steps involved in completing specific actions. Develop an initial information architecture & organising the content and features in a way that makes sense for users.


Users
  • Product Owners | Data Analysts | Data Leaders
Primary user Goal
  • Enable users to track and monitor the carbon footprint.
  • Provide users with the capability to identify specific sources / sites produces carbon emissions.
  • The dashboard should facilitate tracking progress towards Haleon's sustainability goals.
  • Enable users to compare carbon emissions performance across different sites or locations.
  • Dashboard should allow for customization of views and provide interactive features to explore data at a granular level.
Achievements
  • The dashboard provides an intuitive and user-friendly interface, ensuring that users can easily navigate and access the required information.
  • Incorporates effective data visualizations, enabling users to interpret complex data easily and make informed decisions.
  • Successfully integrates with existing systems, providing a holistic view of carbon emissions data across the sites.
  • Provided help & guidance within the dashboard, ensuring users are well-equipped to utilize its features effectively.
  • Successfully communicates the environmental impact of carbon emissions, fostering a sense of responsibility towards environment and organisation's goal by 2030.

Wireframes


BDA-landing.com

Visual Designs


BDA-landing.com